
Wholesale Grid Auctions and Data Center Load Growth Drive Higher Household Utility Bills
Key Takeaways
- National rate pressures have escalated as 116 million electric customers across 49 states face $101 billion in approved or pending rate adjustments.
- Wholesale capacity charges spiked by 833% in the PJM Interconnection footprint, passing direct procurement expenses onto residential utility bills.
- Energy choice programs in deregulated states allow you to protect your household budget by locking in fixed-rate generation supply contracts.
If you opened your electric bill recently and noticed an unexpected jump in monthly charges, you are far from alone. Across the United States, utility companies are passing along substantial price increases driven by surging wholesale capacity auctions, rapid generation retirements, and unprecedented power demands from artificial intelligence data centers. A nationwide review of state regulatory filings shows that more than 116 million residential and commercial accounts are navigating an estimated $101 billion wave of proposed and approved rate adjustments. Understanding how these regional wholesale markets function — and where local utilities are shifting costs — is the first step toward taking control of your monthly energy budget.
Understanding the Hidden Drivers Behind Rising Electric Capacity Charges
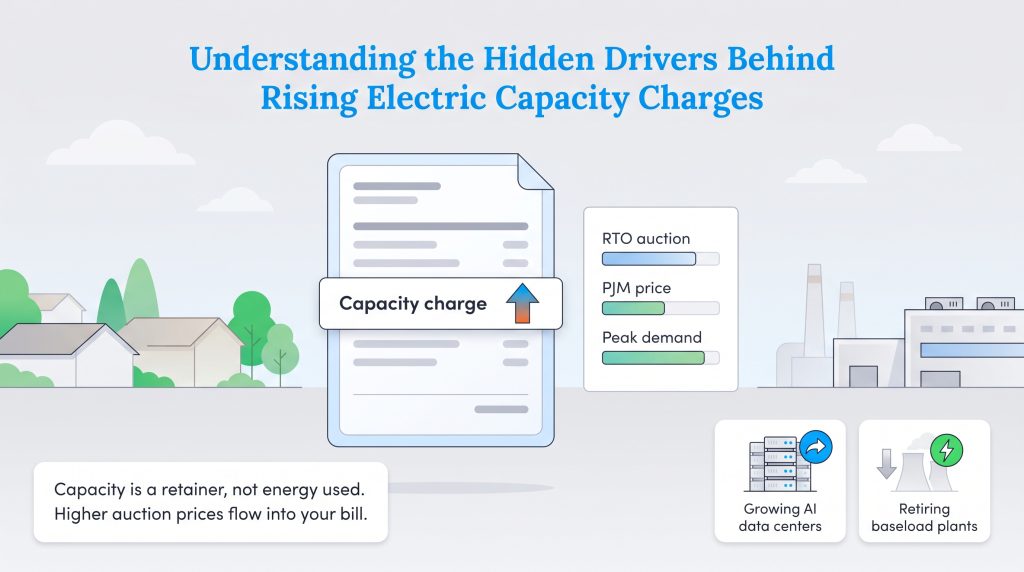
When you pay your monthly electric bill, the total balance reflects two distinct services: distribution delivery from your local utility and the actual electricity supply you consume. Within that supply cost sits a critical reliability component known as capacity.
Capacity is not the electricity you burn when running your air conditioner; rather, it is a retainer payment made to power generators to ensure adequate reserve generation is available during moments of peak grid stress. Regional Transmission Organizations (RTOs) run competitive auctions years in advance to secure this standby power. When reserve margins tighten, auction prices surge, and utilities pass those procurement expenses directly to ratepayers without a markup or buffer.
The 833% PJM Capacity Price Spike
The steepest wholesale shift in modern grid history occurred within PJM Interconnection, the regional grid operator serving 65 million people across 13 Mid-Atlantic and Midwestern states. In recent auction cycles, benchmark capacity clearing prices skyrocketed from $28.92 per megawatt-day (MW-day) to $269.92/MW-day — an astounding 833% increase. In constrained delivery zones, prices pushed against the federal pricing collar established by the Federal Energy Regulatory Commission at $325 to $329.17/MW-day.
This wholesale spike translates directly into residential bill pressure, adding between 1.5 cents and 4 cents per kilowatt-hour (kWh) to standard supply rates. For an average household consuming 1,000 kWh per month, this single line-item adjustment can raise electricity bills by $15 to $40 each month.
Rapid Data Center Expansion and Generation Retirements
Two fundamental market forces are driving capacity supply constraints across regional grids:
- Hyperscale Computing Demand: Modern AI data center campuses require continuous, round-the-clock power loads ranging from 100 megawatts to multiple gigawatts. Data center load forecasts represent over 40% of future capacity requirements in key Mid-Atlantic corridors.
- Baseload Plant Retirements: Older coal-fired and natural gas thermal plants are retiring faster than replacement clean energy and battery storage projects can navigate interconnection queues, tightening the margin between available power supply and peak summer demand.
Regional Impact Breakdown: How Five Key State Markets Are Affected
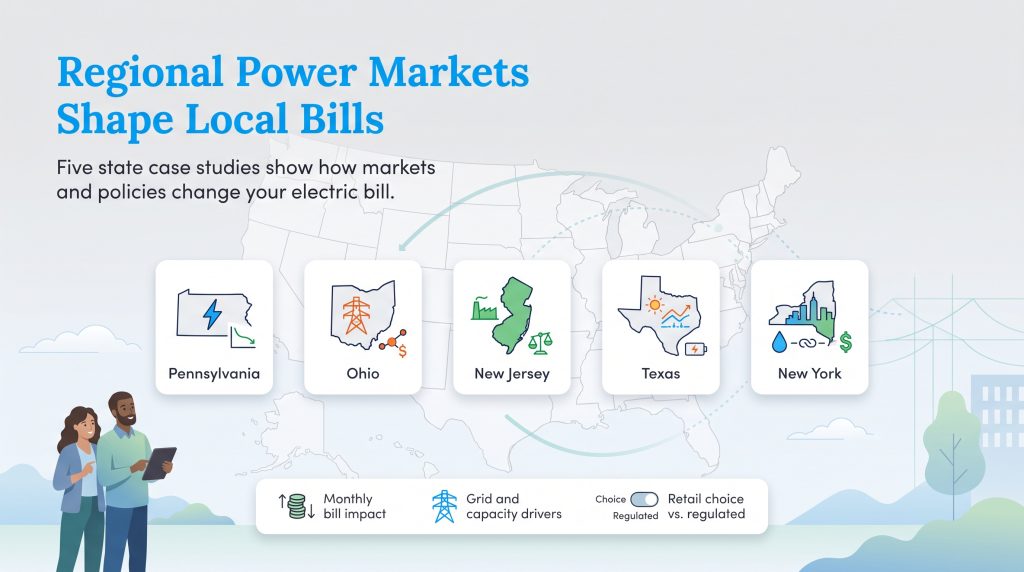
State utility commissions and grid operators are responding differently based on their regulatory market structures. While states with retail energy deregulation give you the freedom to choose your generation supplier, traditionally regulated territories rely solely on public utility commissions to review utility rate cases.
Nationwide 49-State Electricity Rate & Capacity Impact Tracker
| State | Primary Grid Operator / Region | Primary Rate & Capacity Cost Driver | Estimated Monthly Bill Impact | Retail Choice Status |
| Alabama | SERC (Southern Company) | Grid hardening and gas generation expansion | +$8 to $16 / month (5% to 9%) | Traditional Regulated |
| Alaska | Railbelt Intertie / Isolated Grids | Fuel transport logistics and microgrid upgrades | +$12 to $25 / month (6% to 11%) | Traditional Regulated |
| Arizona | WECC (Non-RTO / APS, SRP) | Summer peak capacity and semiconductor loads | +$14 to $28 / month (8% to 14%) | Traditional Regulated |
| Arkansas | MISO / SPP | High-voltage transmission buildouts and severe weather | +$9 to $18 / month (6% to 10%) | Traditional Regulated |
| California | CAISO | Wildfire mitigation capital spending and grid storage | +$22 to $45 / month (12% to 18%) | Limited Choice (CCA / Direct Access) |
| Colorado | WECC (Xcel Energy) | Clean energy transition and transmission upgrades | +$11 to $22 / month (7% to 12%) | Traditional Regulated |
| Connecticut | ISO-NE | Winter reliability capacity and standard service supply | +$18 to $35 / month (11% to 17%) | Full Retail Choice |
| Delaware | PJM Interconnection | PJM wholesale capacity auction price surge | +$16 to $28 / month (10% to 16%) | Full Retail Choice |
| Florida | FRCC / SERC (FPL, Duke) | Storm-hardening riders and solar/battery expansion | +$12 to $24 / month (7% to 12%) | Traditional Regulated |
| Georgia | SERC (Georgia Power) | Nuclear capital recovery and hyperscale data centers | +$15 to $32 / month (9% to 16%) | Limited Choice (Large Commercial) |
| Idaho | WECC (Idaho Power) | Industrial load demand and transmission line expansion | +$7 to $15 / month (6% to 10%) | Traditional Regulated |
| Illinois | PJM / MISO | PJM capacity surge (ComEd) and grid modernization | +$15 to $30 / month (10% to 16%) | Full Retail Choice |
| Indiana | MISO / PJM | Coal plant retirements and transmission rider costs | +$14 to $26 / month (8% to 14%) | Traditional Regulated |
| Iowa | MISO | Wind repowering and regional transmission expansion | +$8 to $16 / month (5% to 9%) | Traditional Regulated |
| Kansas | SPP (Evergy) | Grid resilience riders and generation additions | +$10 to $20 / month (6% to 11%) | Traditional Regulated |
| Kentucky | PJM / MISO / SERC | Coal-to-gas transition and PJM capacity pass-through | +$11 to $22 / month (7% to 12%) | Traditional Regulated |
| Louisiana | MISO (Entergy) | Gulf storm restoration and industrial megaprojects | +$14 to $30 / month (8% to 15%) | Traditional Regulated |
| Maine | ISO-NE | Regional transmission and standard offer rate changes | +$12 to $24 / month (8% to 13%) | Full Retail Choice |
| Maryland | PJM Interconnection | Constrained zone PJM capacity clearing prices | +$18 to $34 / month (12% to 18%) | Full Retail Choice |
| Massachusetts | ISO-NE | Capacity reserve costs and clean energy mandates | +$20 to $38 / month (10% to 16%) | Full Retail Choice |
| Michigan | MISO / PJM | Clean Energy transition plans and distribution upgrades | +$12 to $25 / month (7% to 13%) | Limited Choice (10% Cap) |
| Minnesota | MISO (Xcel Energy) | Carbon-free mandates and regional transmission | +$9 to $19 / month (6% to 10%) | Traditional Regulated |
| Mississippi | MISO / SERC | Severe weather recovery and industrial power demand | +$10 to $20 / month (6% to 11%) | Traditional Regulated |
| Missouri | MISO / SPP (Ameren) | Battery storage additions and baseload retirements | +$11 to $23 / month (7% to 12%) | Traditional Regulated |
| Montana | WECC / MISO / SPP | Transmission constraints and winter reliability reserves | +$8 to $17 / month (6% to 10%) | Limited Choice |
| Nebraska | SPP | Public power generation replacement and grid capacity | +$7 to $14 / month (5% to 8%) | Public Power (Non-Profit) |
| Nevada | WECC (NV Energy) | High-growth data center load and peak summer imports | +$15 to $32 / month (9% to 15%) | Limited Choice (Large Commercial) |
| New Hampshire | ISO-NE | Capacity market charges and default energy services | +$14 to $28 / month (8% to 14%) | Full Retail Choice |
| New Jersey | PJM Interconnection | PJM capacity surge and annual BGS auction adjustments | +$20 to $35 / month (15% to 20%) | Full Retail Choice |
| New Mexico | WECC / SPP (PNM) | Renewable integration and grid reliability upgrades | +$9 to $18 / month (6% to 11%) | Traditional Regulated |
| New York | NYISO | NYC Zone J capacity spikes ($32/kW-month) and transmission | +$12 to $28 / month (8% to 14%) | Full Retail Choice |
| North Carolina | SERC / PJM (Duke) | Multi-year rate plans and data center infrastructure | +$12 to $26 / month (8% to 13%) | Traditional Regulated |
| North Dakota | MISO / SPP | Generation portfolio shifts and transmission buildouts | +$6 to $14 / month (5% to 8%) | Traditional Regulated |
| Ohio | PJM Interconnection | 833% PJM capacity surge and transmission riders (BTCR) | +$18 to $30 / month (10% to 18%) | Full Retail Choice |
| Oklahoma | SPP (OG&E, PSO) | Natural gas fuel cost true-ups and storm hardening | +$10 to $21 / month (7% to 12%) | Traditional Regulated |
| Oregon | WECC (PGE, Pacific Power) | Wildfire mitigation investments and power supply costs | +$14 to $28 / month (9% to 15%) | Limited Choice (Direct Access) |
| Pennsylvania | PJM Interconnection | PJM capacity clearing rates and utility rate filings | +$15 to $25 / month (9% to 15%) | Full Retail Choice |
| Rhode Island | ISO-NE (Rhode Island Energy) | ISO-NE capacity procurement and delivery upgrades | +$15 to $29 / month (9% to 14%) | Full Retail Choice |
| South Carolina | SERC (Dominion, Duke) | Large manufacturing load demand and grid upgrades | +$12 to $24 / month (7% to 12%) | Traditional Regulated |
| South Dakota | MISO / SPP | Regional transmission projects and winter reserve costs | +$7 to $15 / month (5% to 9%) | Traditional Regulated |
| Tennessee | SERC (TVA) | TVA base rate increases and natural gas generation | +$8 to $18 / month (6% to 10%) | Public Power / Traditional |
| Texas | ERCOT | Data center interconnection queue and peak volatility | +$10 to $45 / month (Seasonal swings) | Full Retail Choice (Competitive areas) |
| Utah | WECC (Rocky Mountain Power) | New transmission lines and wildfire liability funds | +$9 to $19 / month (7% to 12%) | Traditional Regulated |
| Vermont | ISO-NE | Transmission reliability and distribution modernization | +$11 to $22 / month (7% to 12%) | Traditional Regulated |
| Virginia | PJM (Dominion, AppPower) | Constrained Dominion zone capacity and data center hubs | +$16 to $32 / month (11% to 17%) | Limited Choice |
| Washington | WECC (PSE, Avista) | Clean Energy Transformation Act costs and hydro limits | +$10 to $22 / month (8% to 13%) | Traditional Regulated |
| West Virginia | PJM Interconnection | Coal plant maintenance and PJM wholesale capacity | +$12 to $25 / month (8% to 14%) | Traditional Regulated |
| Wisconsin | MISO (WEC, Alliant) | Coal plant phaseouts and solar/battery capital costs | +$11 to $22 / month (7% to 12%) | Traditional Regulated |
| Wyoming | WECC / SPP (PacifiCorp) | Generation upgrades and inter-state transmission lines | +$8 to $17 / month (6% to 10%) | Traditional Regulated |
(Note: Hawaii operates on isolated island microgrids with fuel-indexed rates and is excluded from the 49-state interconnected grid tracking dataset.)
Pennsylvania: Capacity Settlements Cushion Historic Spikes
In Pennsylvania, residential customers in the service territories of PECO, PPL Electric Utilities, Duquesne Light, and FirstEnergy utilities (Met-Ed, Penelec, Penn Power, and West Penn Power) have faced steady supply adjustments. Regulatory intervention led by state officials established auction caps that saved households an estimated $207 annually compared to uncapped market projections.
- Impacted Areas: Philadelphia, Pittsburgh, and Allentown.
- Counties Affected: Allegheny, Philadelphia, Bucks, Montgomery, Chester, Delaware, Lehigh, Northampton, Berks, and Dauphin counties.
Ohio: Transmission Riders and New Data Center Tariffs
Ohio ratepayers across American Electric Power (AEP Ohio), Duke Energy Ohio, AES Ohio, and FirstEnergy (Ohio Edison, Toledo Edison, The Illuminating Company) have experienced both wholesale capacity pass-throughs and delivery rider hikes. In central Ohio, AEP Ohio updated its Basic Transmission Cost Rider (BTCR) to fund high-voltage grid upgrades, adding approximately $7.90 per month to typical residential bills. In response, the Public Utilities Commission of Ohio approved specialized large-load tariffs requiring data center operators to provide upfront financial collateral and pay dedicated infrastructure fees.
- Impacted Areas: Columbus, Cleveland, and Cincinnati.
- Counties Affected: Franklin, Cuyahoga, Hamilton, Lucas, Summit, Montgomery, and Stark counties.
New Jersey: Board of Public Utilities Calls for Wholesale Reform
New Jersey households served by Public Service Electric and Gas (PSE&G), Jersey Central Power & Light (JCP&L), Atlantic City Electric, and Rockland Electric experienced bill increases approaching 20% following annual Basic Generation Service (BGS) auctions. In an official evaluation released on Aug. 13, 2026, the New Jersey Board of Public Utilities called for sweeping structural reforms to PJM’s capacity rules to replace volatile price spikes with incentives for long-term power generation.
- Impacted Areas: Newark, Jersey City, and Atlantic City.
- Counties Affected: Essex, Hudson, Bergen, Middlesex, Monmouth, Ocean, Camden, and Atlantic counties.
Texas: Interconnection Moratoriums and Peak Grid Management
Unlike the Mid-Atlantic states, the Electric Reliability Council of Texas (ERCOT) operates an energy-only wholesale market without forward capacity auctions. However, rapid commercial demand growth has pushed ERCOT’s interconnection queue above 474 GW — over 90% of which represents data center requests. Following a record hourly peak demand of 91.1 GW on July 22, 2026, state regulators initiated a project-by-project audit and temporary connection pause on large loads to protect residential consumers from transmission expansion costs.
- Impacted Areas: Houston, Dallas, and San Antonio.
- Counties Affected: Harris, Dallas, Tarrant, Travis, Bexar, Collin, Denton, and Williamson counties.
New York: Downstate Transmission Bottlenecks in NYISO
In New York, wholesale power dynamics are managed by the New York Independent System Operator (NYISO). Downstate transmission constraints in New York City (Zone J) and Long Island (Zone K) drove summer local capacity costs above $32 per kilowatt-month. While upstate territories served by National Grid, NYSEG, and Rochester Gas & Electric enjoy access to zero-emission hydroelectric resources, downstate customers under Consolidated Edison (Con Edison) pay higher capacity premiums to maintain local grid reliability.
- Impacted Areas: New York City (all five boroughs), Buffalo, and Albany.
- Counties Affected: New York, Kings, Queens, Bronx, Richmond, Westchester, Erie, Monroe, and Onondaga counties.
Actionable Steps to Protect Your Household Electric Budget
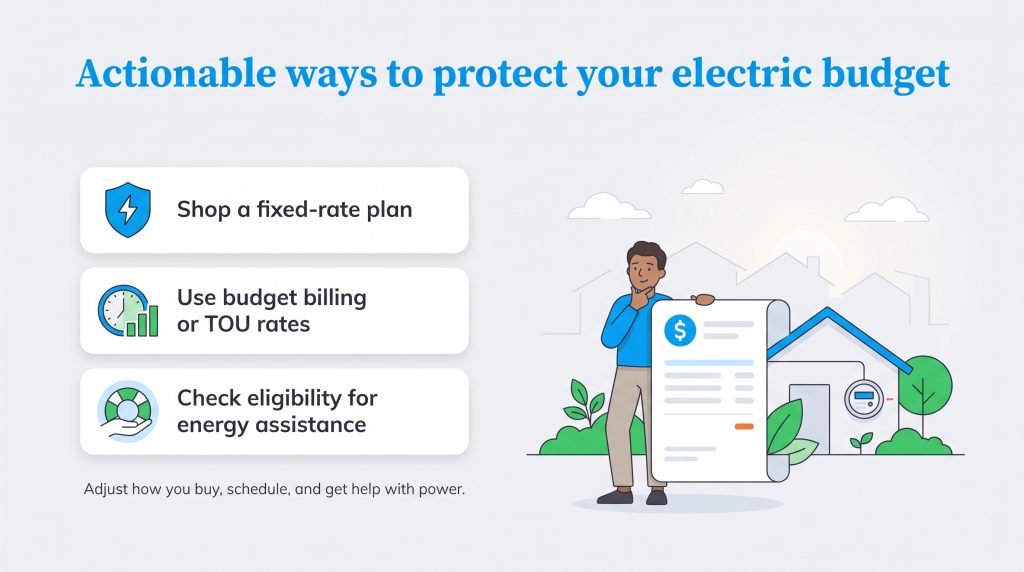
While regional grid pricing trends are decided at the regulatory level, you have several direct tools to lower your monthly bills and insulate your home from seasonal price spikes.
                  ┌─────────────────────────────────────────┐
                  │ Evaluate Your Electricity Bill Strategy │
                  └────────────────────┬────────────────────┘
                                       │
                Is your home located in a deregulated state?
                                       │
                     ┌─────────────────┴─────────────────┐
                     ▼                                   ▼
                   [YES]                                [NO]
                     │                                   │
       Check your utility's default              Enroll in utility
          Price-to-Compare (PTC)                 Time-of-Use (TOU)
                     │                            or Budget Billing
                     ▼                                   │
      Compare competitive suppliers                      ▼
         on official state portals               Audit home energy use
     (PA Power Switch, Power to Choose)          via ENERGY STAR tools
                     │                                   │
                     ▼                                   ▼
       Lock in a 12–24 month fixed rate          Explore rebate & bill
       with $0 monthly & cancellation fees       assistance programs (LIHEAP)
1. Shop for a Fixed-Rate Electricity Supply Plan
If you live in a deregulated market like Pennsylvania, Ohio, New Jersey, or Texas, you do not have to buy your power supply from your default utility:
- Find Your Price-to-Compare (PTC): Locate the supply rate on your monthly bill. This represents the baseline cost per kilowatt-hour your utility charges to supply power.
- Use Official State Shopping Portals: Visit state-administered shopping sites like PA Power Switch, Energy Choice Ohio, NJ Power Switch, or Texas Power to Choose.
- Choose Fixed-Rate Contracts: Look for a 12-month to 24-month fixed-rate plan that undercuts your utility’s default rate. Avoid variable-rate offers that expose your bill to mid-summer wholesale spikes.
- Inspect the Contract Fine Print: Verify that the supplier contract has no monthly base enrollment fees, no tiered-rate thresholds, and reasonable or zero early termination penalties.
2. Leverage Utility Billing Options and Assistance Programs
Even if you reside in a traditionally regulated market, you can optimize how your utility bills your usage:
- Budget Billing / Balanced Payment Plans: Your utility averages your annual electricity consumption across 12 equal monthly installments, eliminating winter heating and summer cooling bill spikes.
- Time-of-Use (TOU) Rates: If your home has a smart meter, shifting laundry, dishwashing, and electric vehicle charging to off-peak evening or overnight hours can reduce your effective supply rate.
- Energy Assistance (LIHEAP): Income-qualified households can apply for the federal Low-Income Home Energy Assistance Program (LIHEAP) and state-specific utility hardship funds to offset seasonal balance increases.
Navigating the Future of Home Energy Affordability
Managing your electricity costs requires staying informed as utilities and state commissions update their seasonal rates. With wholesale capacity auctions reflecting growing grid demands and infrastructure updates underway across the country, comparing your supply options and monitoring your home peak usage will remain essential strategies for protecting your family budget in the years ahead.
Frequently Questions About Electricity Capacity Costs
What is the difference between electric supply and delivery charges?
Why do data centers cause residential electricity rates to rise?
Can I avoid capacity charges by switching electric suppliers?
How do I find out who provides my electric supply?
About the Author

Claudio is a sustainability-focused writer with a background in Anthropology and Psychology from NC State University. He has spent over 15 years working in writing, interpretation, and translation, driven by a deep interest in how human culture shapes the environment. Today, he shares his curiosity with readers by writing about sustainable living solutions and the connection between everyday choices and environmental impact.