Track Your Consumption to Identify Energy Hogs and Lower Your Monthly Utility Bills
Key Takeaways
- You can calculate appliance electricity cost manually using a simple formula based on the wattage listed on the device’s label.
- An electricity usage monitor plug is the most accurate tool for finding phantom loads and measuring variable-power devices like refrigerators.
- Whole-house monitoring systems connect to your breaker panel or utility meter to provide real-time data on your home’s total energy footprint.
Understanding exactly where your power goes is the first step toward lowering your monthly bills and reducing your carbon footprint. Whether you are dealing with a surprisingly high statement or simply want to live more sustainably, measuring electric usage removes the guesswork from your household budget. By identifying which appliances are energy hogs and which are efficient, you can make smarter decisions about when to run your dishwasher, whether to replace an old refrigerator, or how to eliminate wasteful standby power. In this guide, we show you how to check electricity usage at home using practical methods like manual calculations, smart plugs with energy monitoring, and whole-home digital tracking.
Why Measuring Your Electricity Matters
If you want to stop dreading your monthly statement and start understanding your electric bill, you need to know exactly what is driving your costs up. Taking the time to measure your electricity usage helps you uncover hidden expenses and make simple lifestyle changes that keep more money in your wallet. When you actively monitor your consumption, you gain the power to:
- Identify phantom loads: Find and unplug electricity vampires that secretly drain power even when they are seemingly turned off.
- Budget for electric bills: Anticipate seasonal cost spikes by calculating your expected kWh per month.
- Lower your carbon footprint: Make environmentally mindful choices by reducing your overall household demand on the local power grid.
Essential Metrics: Understanding Watts, kW, and kWh
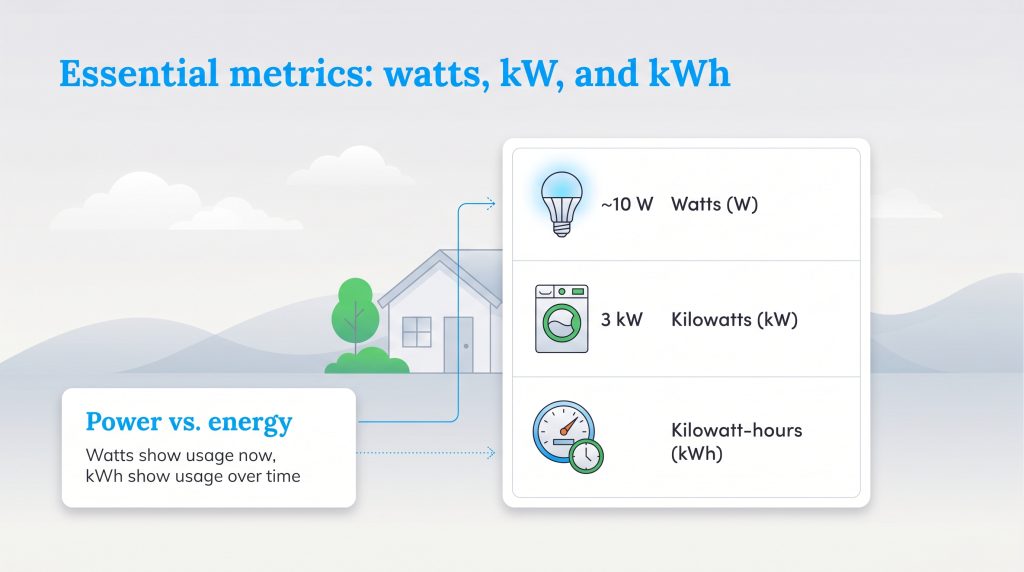
Before you evaluate your home’s energy consumption, you need a quick grasp of the terminology found on appliance labels and utility bills. Think of electricity like water flowing through a pipe — the pressure, volume, and duration all determine your final cost. The core difference to remember is that Watts measure power at a single moment, while kWh measures the total energy used over time. Keep these three primary definitions in mind:
- Watts (W): A measure of electrical power at an exact instant. It indicates the maximum power an appliance requires to operate. For example, a standard LED lightbulb typically draws around 10 Watts.
- Kilowatts (kW): Because measuring high-power appliances in singular watts gets messy, utility companies use kilowatts. One kilowatt simply equals 1,000 watts. A 3,000-watt electric clothes dryer operates at 3 kW.
- Kilowatt-hours (kWh): This golden metric appears on your monthly utility bill. A kilowatt-hour represents the total energy consumed if a 1,000-watt appliance runs continuously for one full hour.
How to Measure Electric Usage by Device
Finding out which specific appliances are driving up your costs is crucial for targeted savings. Measuring electricity usage by device lets you identify inefficient machines and isolate costly vampire electronics.
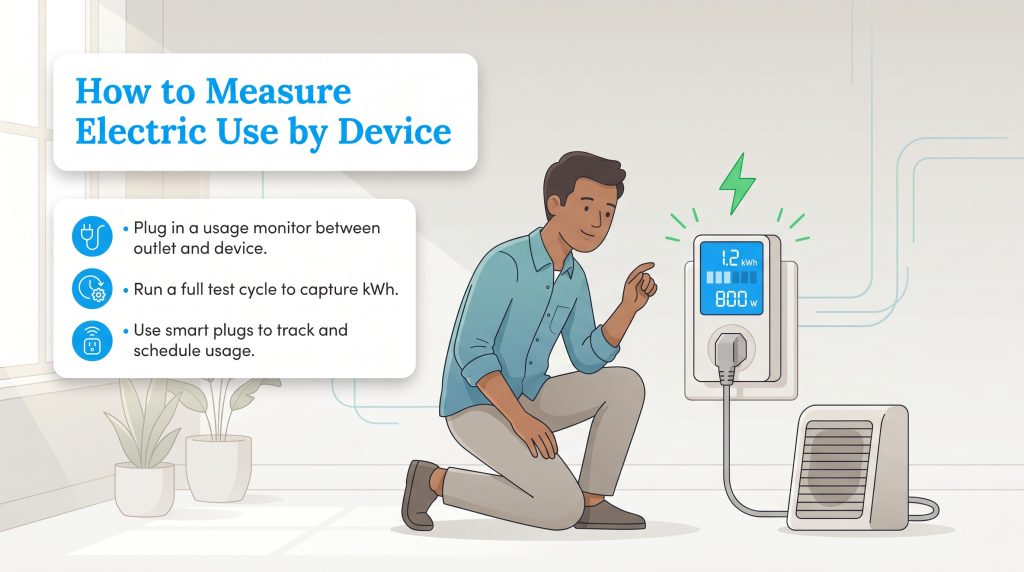
Use a Plug-In Electricity Usage Monitor
A plug-in electricity usage monitor is the most accurate tool for pinpointing energy hogs. Also known as a Kill-A-Watt meter, this hardware sits between your wall outlet and your appliance plug to record exactly how much power flows through the cord. Use this simple method to test your devices:
- Plug the monitor into the wall: Insert the usage monitor directly into a standard wall receptacle.
- Connect the appliance: Plug the device you want to test into the front face of the monitor.
- Run a test cycle: For appliances that cycle on and off throughout the day — like a refrigerator or window AC unit — leave them connected for a full 24 to 48 hours to capture an accurate average.
- Read the output: Check the digital display to see precisely how many kWh were consumed during your testing window.
Track with Smart Plugs
For a more modern approach, we highly recommend upgrading to smart plugs with energy monitoring capabilities. These devices transmit electrical data directly to a smartphone app in real time. You can view colorful graphs detailing your hourly, daily, and monthly usage trends without ever having to crawl behind a dusty entertainment center. Even better, smart plugs let you set automated schedules, allowing you to easily cut power to known energy hogs while you sleep or commute to work.
How to Measure Whole-Home Electricity Usage
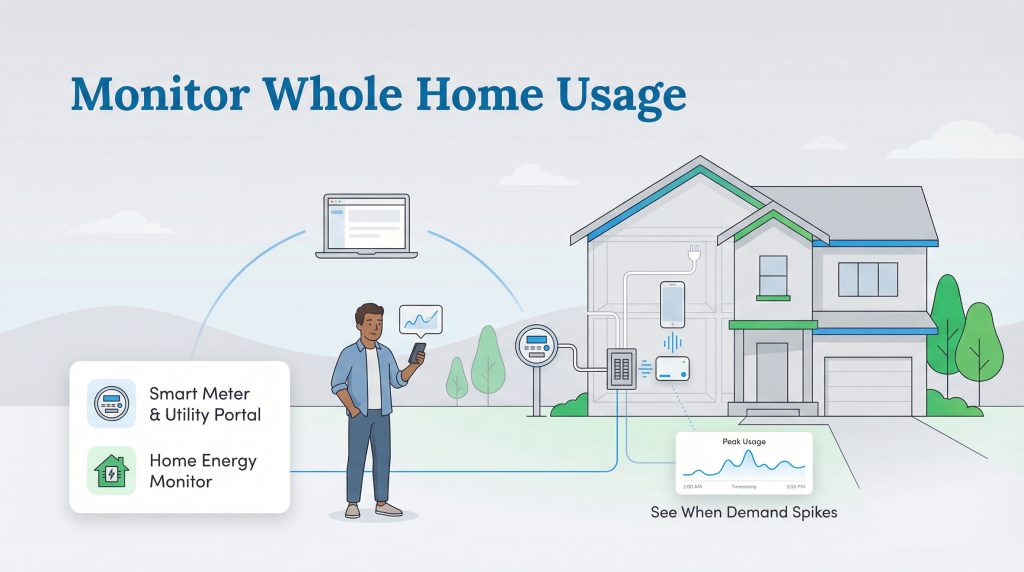
If you want to understand your home’s total environmental footprint, you need to track energy consumption across your entire property. Whole-home tracking reveals when your daily demand peaks, such as when your central air conditioning kicks on aggressively during a heatwave or when an electric vehicle begins charging in the garage.
Read Your Smart or Analog Electric Meter
Your primary source of whole-home data is the utility meter attached to the outside of your house. If you have an older analog meter, it relies on spinning discs and physical dials to track your usage over the month. You can estimate your daily use by recording the numbers at the exact same time every day and calculating the difference.
However, most modern homes now feature an advanced digital smart meter. These upgraded meters send precise data to your utility provider in short intervals. You can usually log in to your provider’s web portal to view your smart meter reading explained through intuitive, seasonal dashboards. For more information on how these systems communicate, review how advanced digital meters report data.
Install a Whole-House Energy Monitor
If you desire granular, real-time insights without waiting for your provider’s online dashboard to refresh, you should install a dedicated home energy monitor inside your electrical panel. Standard aftermarket monitors use clamp-on sensors connected to your main power cables to measure your total wattage instantly.
Upgrading to a smart electrical panel takes this a step further by offering circuit-level energy monitoring. This technology allows you to view usage on a per-circuit basis right from a companion app — letting you see exactly how much power your kitchen lighting draws compared to your master bedroom. You can even remotely turn specific breakers on or off, providing ultimate safety and control during a neighborhood grid outage.
How to Calculate Your Appliance Energy Costs Manually
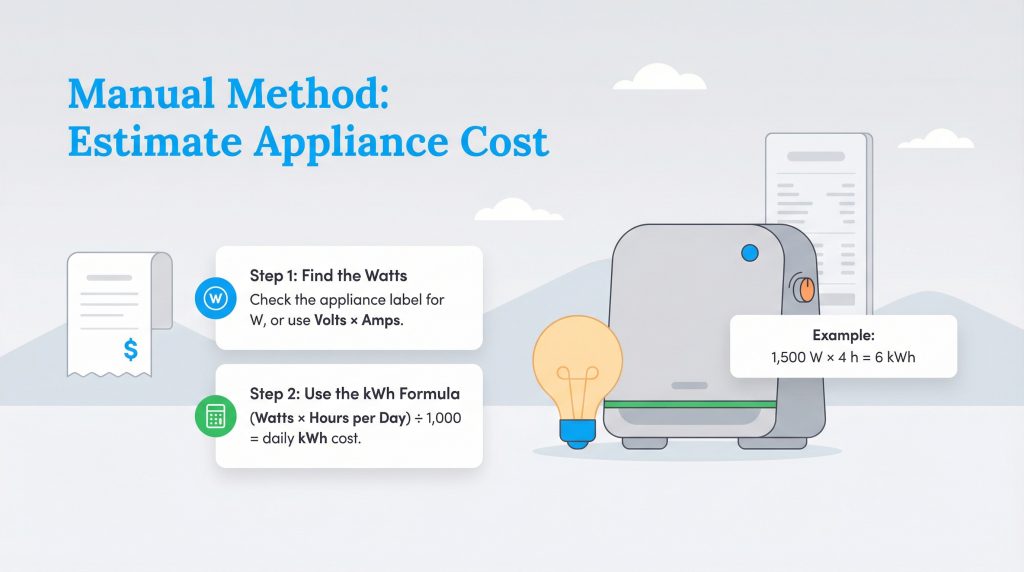
If you want a quick estimate without purchasing any extra hardware, you can calculate appliance electricity cost manually. This method works perfectly for devices with a constant energy draw, such as traditional lightbulbs or space heaters. First, locate the appliance’s wattage on its back label or power cord. Once you have the total wattage, use the following formula to determine its exact energy consumption:
(Appliance Wattage × Hours Used Per Day) ÷ 1000 = Daily kWh
Let’s run a real-world example. If you operate a 1,500-watt space heater for 4 hours a day, the calculation looks like this: (1,500 × 4) ÷ 1,000, which equals exactly 6 kWh per day. To calculate your electric bill impact, simply multiply that result by your provider’s average electricity rate. If your utility company charges $0.15 per kWh, running that space heater costs you $0.90 per day (6 kWh × $0.15), adding roughly $27 to your monthly statement.
Average Household Electricity Usage Cheat Sheet
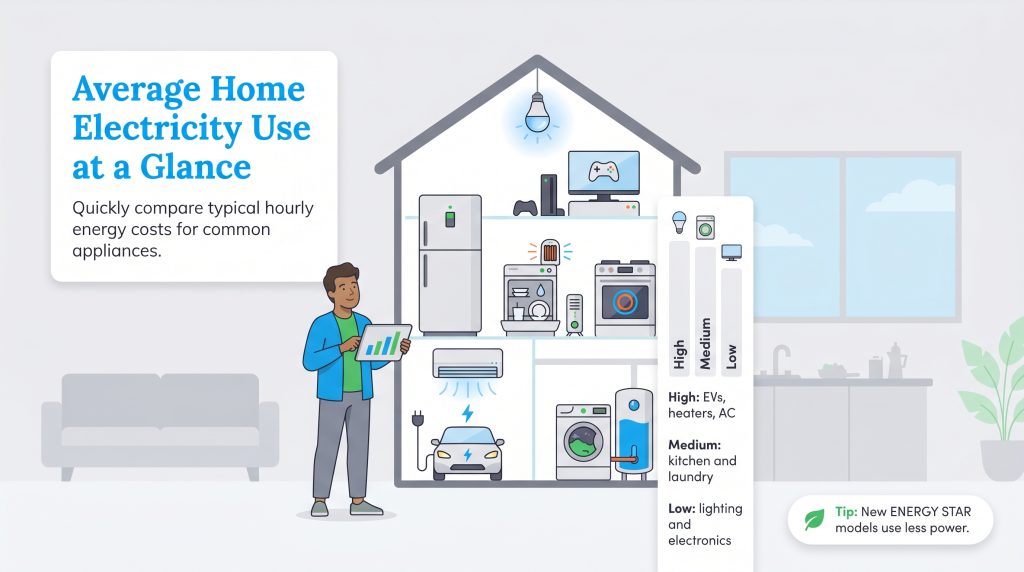
To help you evaluate your manual calculations, the reference chart below provides a solid baseline for typical appliance energy consumption. Keep in mind that older, poorly maintained appliances will inherently consume more power than modern models.
| Appliance | Average Wattage | Estimated Cost per Hour (at $0.15/kWh) |
|---|---|---|
| Electric Vehicle (Level 2 Charger) | 7,200W | $1.08 |
| Water Heater | 4,500W | $0.68 |
| Central Air Conditioning | 3,500W | $0.53 |
| Electric Clothes Dryer | 3,000W | $0.45 |
| Induction Stove (per large burner) | 2,500W | $0.38 |
| Dishwasher | 1,800W | $0.27 |
| Space Heater | 1,500W | $0.23 |
| Refrigerator | 150W – 400W | $0.02 – $0.06 |
| Gaming Console | 100W – 200W | $0.02 – $0.03 |
| LED Lightbulb | 10W | < $0.01 |
Taking Action on Your Energy Data
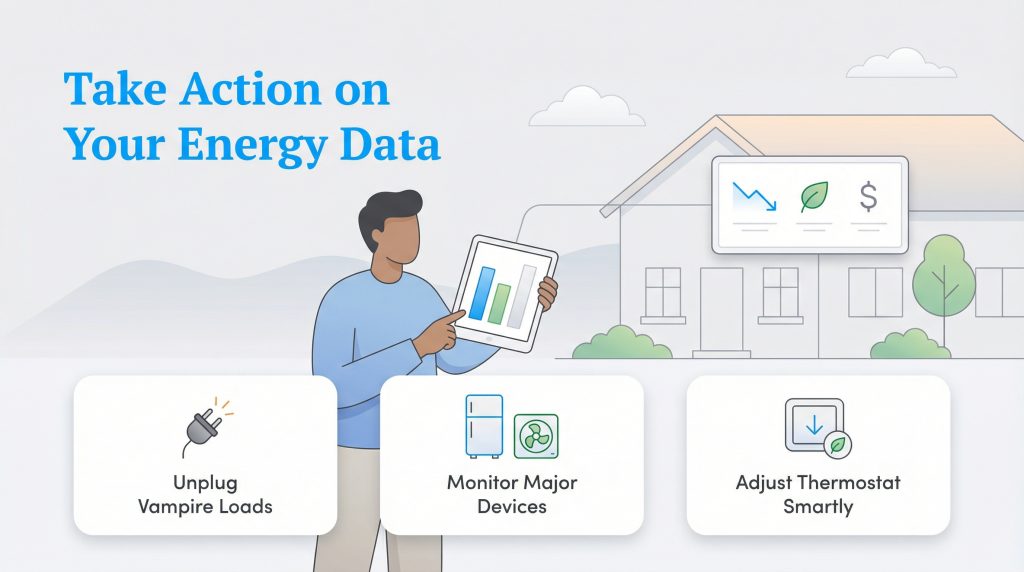
Gathering data on your electrical usage is only valuable if you actively use those insights to modify your daily habits. Once you definitively know which devices cost you the most, you can intentionally build a more sustainable, resilient home. Take the following four actionable steps to lower your utility bills today:
- Upgrade to ENERGY STAR appliances: Replace your oldest, least efficient household devices with certified models that naturally pull far less continuous wattage.
- Eliminate phantom loads by unplugging: Physically unplug vampire electronics — like coffee makers and gaming consoles — when they are not actively in use.
- Utilize smart power strips: Group related devices together on an advanced power strip so you can shut down an entire home office or entertainment center with a single switch.
- Adjust thermostat settings: Heating and cooling typically dominate your utility bill, so shifting your thermostat by just a few degrees during peak usage hours creates massive savings.
To stop feeling overwhelmed, begin by focusing on just one room in your house. Building momentum in a single area makes tracking highly manageable. By combining manual formulas with modern smart plug monitors, you will successfully eliminate unnecessary household waste and significantly reduce your energy consumption. If you are looking for additional strategies to implement, explore our comprehensive guide on how to save on your electric bill.
Frequently Asked Questions About Measuring Electric Usage
What appliances use the most electricity in a home?
Heating and cooling systems typically consume the most electricity in a standard home, followed closely by water heaters, electric clothes dryers, and refrigerators. Using a whole-house energy monitor helps you track exactly how much these large appliances impact your bill.
How do I check my daily electricity usage?
You can easily check your daily usage by logging into your utility provider’s online portal if you have a smart meter. Alternatively, installing a home energy monitor provides a real-time, circuit-level breakdown of your daily electrical demand directly to your smartphone.
Can a faulty electric meter cause high bills?
Yes, while relatively uncommon, a damaged or malfunctioning electric meter can record incorrect data and falsely inflate your monthly bill. If you suspect an ongoing issue, contact your utility provider to request a physical meter inspection or an official calibration test.
What is the most accurate way to measure electricity usage?
The most accurate method for individual appliances is using a plug-in electricity usage monitor or a Wi-Fi smart plug. These physical devices measure the actual electrical draw over a set period rather than relying on a static estimation from a manufacturer’s label.
How do I measure electricity usage at home without a smart meter?
If you have an older analog meter, you can roughly estimate your home’s total usage by checking the physical spinning dials at the same time each day and calculating the difference. Additionally, installing a clamp-on home energy monitor directly into your electrical panel provides rich digital data regardless of your utility meter type.
What is a phantom load?
A phantom load, frequently called vampire power, refers to the passive electricity consumed by smart televisions, gaming consoles, and microwaves even when they are technically turned off or resting in a standby mode.
How can measuring my electricity usage help the environment?
When you actively measure your personal electricity usage, you gain the actionable data needed to spot wasteful habits and inefficient home devices. Upgrading those appliances lowers your overall demand on the grid, which directly results in fewer fossil fuels being burned and shrinks your carbon footprint.
About the Author

David has been an integral part of some of the biggest utility sites on the internet, including InMyArea.com, HighSpeedInternet.com, BroadbandNow.com, and U.S. News. He brings over 15 years of experience writing about, compiling and analyzing utility data.